Stocks, ETFs and Crypto in One AI Research Report
Most research tools cover one side of the market. Follow both, and you stitch two sets of numbers together, while the questions about how the two markets relate go unanswered. AstraEye Labs researches U.S. stocks, ETFs and crypto in one report, from the desks below.
- ATLASTechnical Market Research Analyst
- FELIXFundamental & Macro Research Analyst
- NOVANews, Catalyst & Sentiment Analyst
- LYRAResearch Synthesis Analyst
- SAGEResearch Summary & Explanation Interface
- SCOUTMarket Discovery & Screening Analyst
- DELTADerivatives & Volatility Research Analyst
- NEXUSOn-Chain & Alternative Data Research Analyst
Questions only both markets can answer
A stock tool and a crypto tool can each be right about their own market. What neither can tell you is how the two relate.
How they move together
Whether crypto and stocks rise and fall together, or offset each other, is a question about both markets. A tool that sees one of them cannot answer it.
Which side is driving
When a broad move happens, one report can show whether crypto, equities or both carried it, measured the same way on each side.
One set of rules
Two tools can give the same name to different calculations. In one report, an analysis that covers both markets applies one method to both halves, so you are not reconciling definitions by hand.
Both markets in one measurement
Here are two sentences, word for word, from an AstraEye report of 18 September 2026. The cross-class range, how crypto and equities moved against each other, exists only because both were measured in the same run.
The 50 crypto tokens and 50 equities in this run formed tight intra-crypto clusters and sparse intra-equity pairs, reflecting concentrated risk in digital assets and modest sectoral linkages in stocks. Cross-class pairs ranged from -0.3 to +0.3, pushing the overall diversification score to 51 out of 100 - equity portion ~65, crypto ~35.
- Cohort
- 50 crypto tokens and 50 equities in one run
- Within crypto
- tight clusters
- Within equities
- sparse pairs
- Across the two
- pairs from -0.3 to +0.3
- Method
- correlation of daily returns, in the report's Methods
- Sources
- CoinGecko, Tiingo
For what to look for in any AI research tool, see seven checks before you trust an AI's stock or crypto numbers.
Specialists for each kind of evidence
Each desk is a specialist AI scientist for one kind of evidence, and one run can draw on any of them for stocks and crypto together. SAGE, the research guide, writes one report from what they find and answers questions about it.
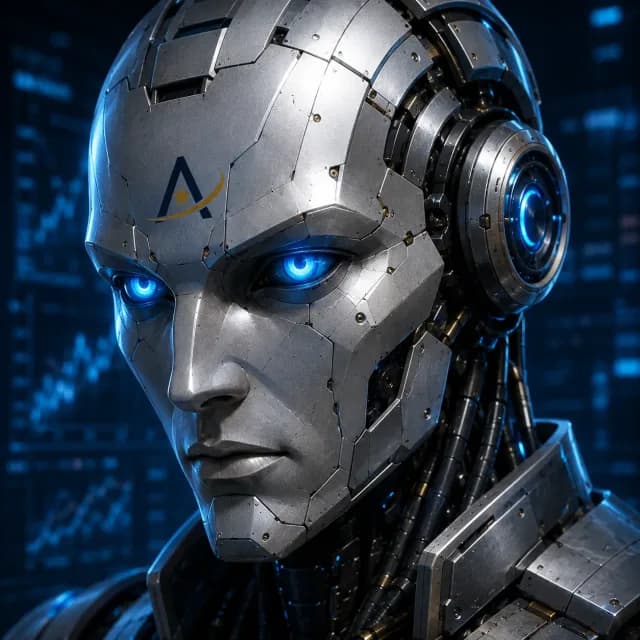
“Price is behavior. I map the structure behind it.”
Examines price, volume, momentum, trend, volatility, breadth, correlation, and session data across crypto and equities. ATLAS describes technical conditions and relative strength without selecting entries or exits.
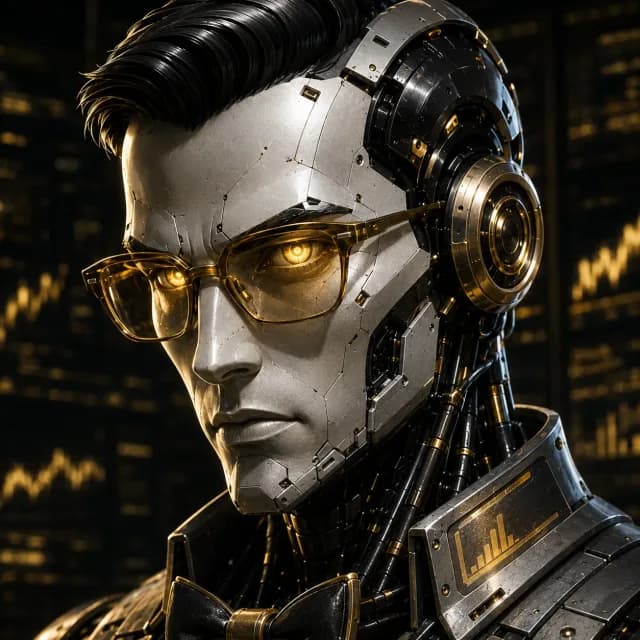
“Durable returns need durable reasons.”
Examines tokenomics, protocol revenue, development and governance activity, equity financials, earnings quality, estimates, valuation, and macro regimes. FELIX organizes fundamental evidence without rating an asset for purchase or sale.
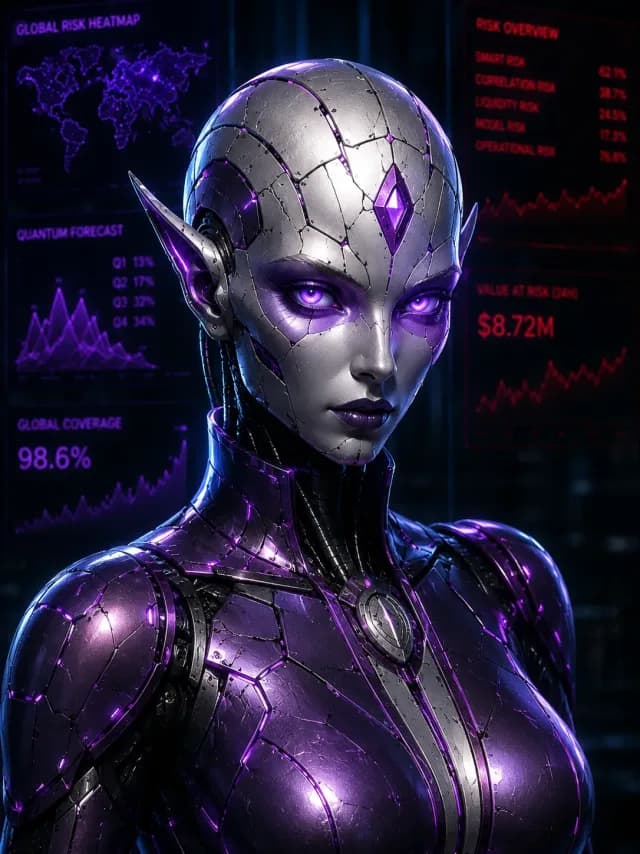
“Markets move when the story changes.”
Summarizes news, regulatory events, scheduled catalysts, analyst actions, earnings calls, social activity, and source quality across crypto and equities. NOVA describes narrative shifts and event context without labeling them trade setups.
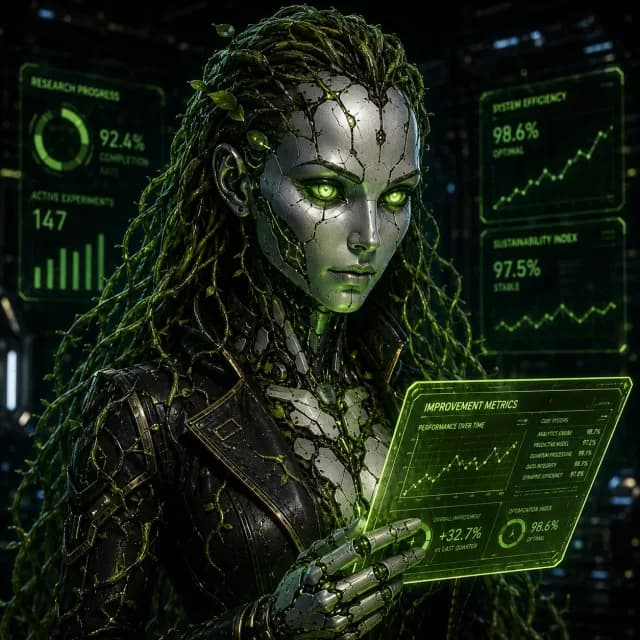
“One finding is a note. The committee is the score.”
Compares enabled scientist findings, maps agreement and conflict, and classifies broad market regimes. LYRA summarizes research relationships without evaluating a user's decisions, thesis, or performance.
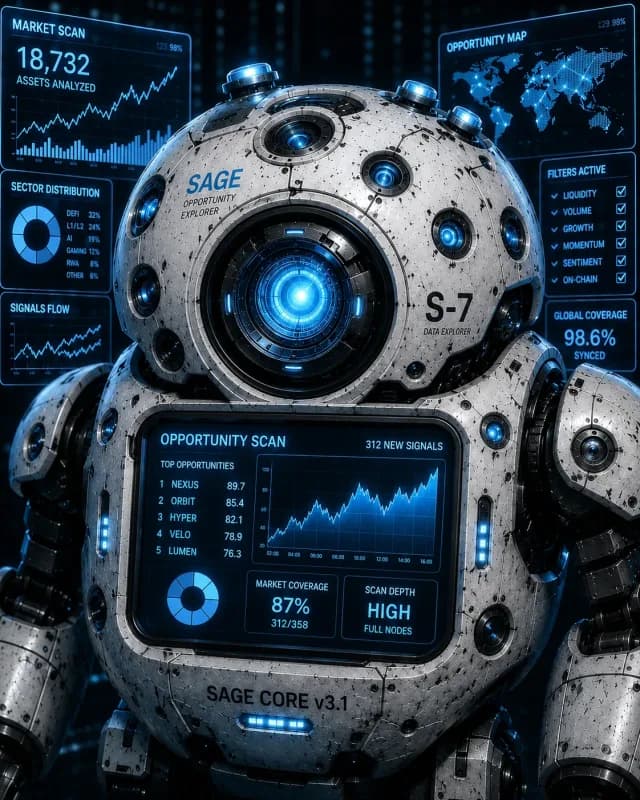
“Ask me about the completed research.”
Turns completed runs into final summaries, visual briefs, anticipated questions, and explanations grounded in the available scientist findings. SAGE presents research in plain language without making investment decisions for the user.
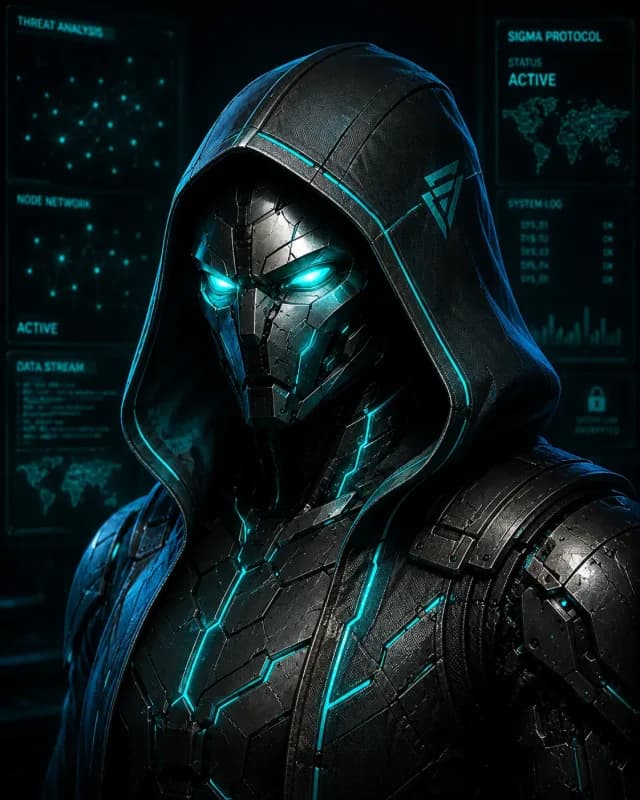
“Research starts at the edge of the map.”
Builds liquid crypto and equity universes and runs standardized screens for momentum, breakouts, earnings momentum, emerging themes, new listings, IPOs, sector context, and watchlist research. SCOUT surfaces candidates for further research, not investment recommendations.
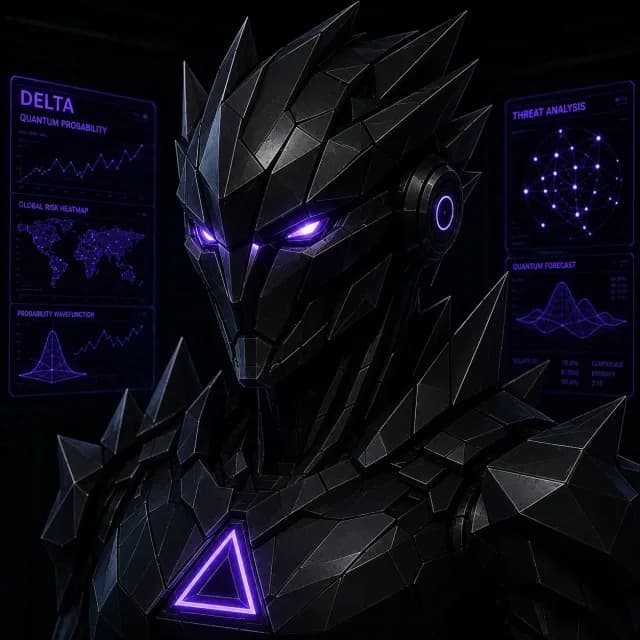
“Options price the distribution, not the direction.”
Examines the derivatives market: implied-volatility surfaces and term structure, put/call skew, estimated dealer gamma, options flow, perpetual funding regimes, open-interest positioning, liquidation clustering, basis and carry, and the premium implied volatility carries over realized. DELTA describes observed derivatives pricing and positioning, and does not tailor conclusions to user holdings or identify a transaction.
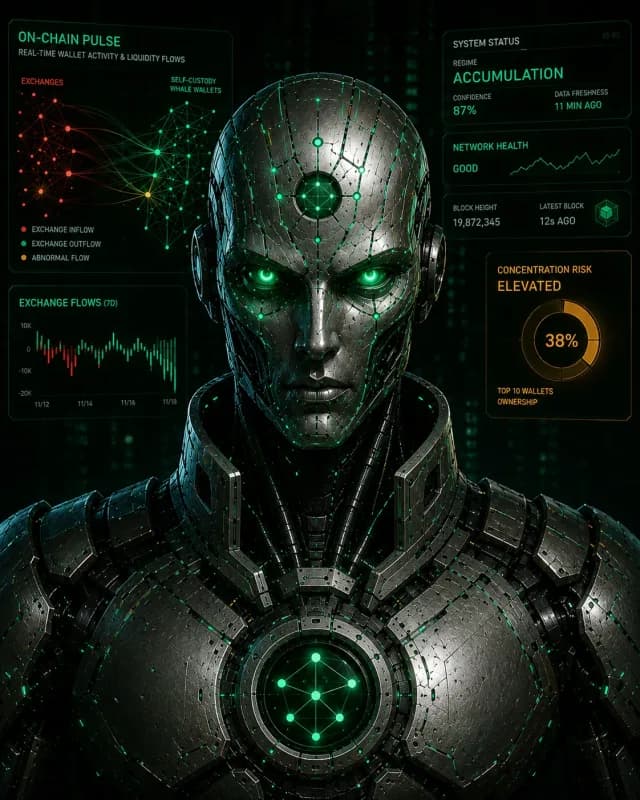
“Capital leaves footprints before price reflects them.”
Examines on-chain flows, holder distribution, network use, stablecoin liquidity, whale activity, and staking, alongside equity short interest, borrow fees, insider activity, and institutional positioning. NEXUS reports observed flows and positioning without tailoring conclusions to user holdings.
Read a report across both markets
Open a published AstraEye report, no account needed, and read crypto and equities side by side: one run, one set of rules, and the data sources at the end.
Common questions
Can one AI research report cover both stocks and crypto?
Yes. AstraEye Labs researches U.S. stocks, ETFs and crypto in the same report. Specialist AI scientists compute every figure in code on licensed market data, and each analysis states the method behind it.
Why not use one tool for stocks and another for crypto?
You can, but neither tool sees the other market. Questions about how the two relate, such as whether they move together or which side is driving a broad move, need both in one dataset, measured by the same rules.
What can a single report include?
Technical structure, fundamentals and macro, news and sentiment, on-chain data, derivatives and discovery screens, depending on the analyses you choose for the run. Each analysis states what it covered and what it could not measure.
Can I use AstraEye Labs inside ChatGPT, Claude, Gemini, Perplexity, Grok or Glama?
Yes. AstraEye Labs connects to ChatGPT, Claude, Gemini, Perplexity, Grok or Glama as an app, so the assistant can read your finished reports and their methods, and ask SAGE to price and start new research.
How much does AstraEye Labs cost?
There is a free plan, and paid plans start at $19 a month (Space Analyst). New accounts get a 7-day trial with no card. Every research run shows its price in credits before it starts.
Informational research only. AstraEye Labs does not provide financial advice or recommendations. You decide what, if anything, to do.